Workflow Visualiser
The Norsk Visualiser allows you to view the current state of your Norsk Media application. You can use it to see what media nodes are running, how they are connected, and how media is flowing through the system.
Getting Started
The visualiser can be found at http://127.0.0.1:6791/visualiser/ when Norsk Media is running.
The Norsk Visualiser
Starting up a simple Norsk application, you will see something like this:
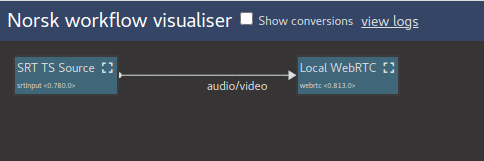
Here the "SRT to WebRTC" example is running, and the visualiser shows the two media nodes, headed by the generic node description and subtitled
with the node IDs (srtInput and webrtc in this example). The arrow connecting the nodes indicates that there is an active subscription. The line is
annotated here with audio/video indicating that the input pins audio and video on the target are involved in this subscription, while hovering the line will show the subscribed stream keys.
Clicking on the "show conversions" option expands the view:
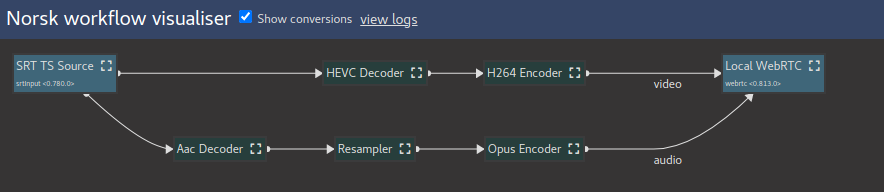
Here we see that the audio and video subscriptions are split apart into two paths, and the conversions that Norsk implicitly inserts between the explicitly created media nodes are shown. In this example I have ingested an SRT source containing HEVC video, and the WebRTC output does not support HEVC, so a HEVC decoder and H264 encoder are inserted. Similarly the AAC audio is decoded and re-encoded as Opus for WebRTC.
You will often want to have explicit control over video encodes, and by inserting an explicit Video Encode Ladder you would expect these implicit encodes to no longer be generated. You can use the conversions view to check that no unintended conversions are taking place.
Diving Deeper
Norsk also provides a more detailed view of the internals of individual media nodes that can be helpful in understanding the current state and the flow of media through the system. Clicking on the View Linked Workflow icon ![]() in the top right of a media node box navigates to the visualiser view for the workflow for that node.
in the top right of a media node box navigates to the visualiser view for the workflow for that node.
Here the boxes represent individual processors in a workflow, and the arrows represent the flow of media (e.g. encoded or raw video frames, or audio, etc). From the above example we see as part of the SRT source, there is a processor node taking packets from the network:
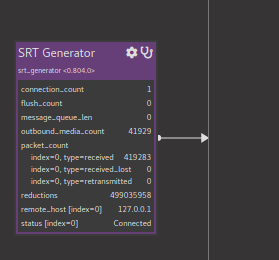
Various metrics are visible on this processor, both SRT-specific metrics (received and dropped packets) and generic ones (number of packets that have been sent out of the processor). These same metrics are also exported for external consumption, e.g. via prometheus, while the visualiser can be used to understand a running system or identify metrics of interest to track.
A special entry last_inbound_context shows a debug view of the context recieved by the processor. This is similar to the media contexts of Norsk Media nodes; while not a substitute for interacting with the context notifications and subscriptions in the API, this can be used to "sample" metadata at a certain point in the system.
In some cases at the end of the workflow a downstream link is shown, representing a subscribed Norsk Media node: